UDC 633.111.1“324”:631.559 doi: 10.21498/25181017.19.4.2023.291222
The V. M. Remeslo Myronivka Institute of Wheat, NAAS of Ukraine, Tsentralne, Obukhiv district, Kyiv region, 08853, Ukraine, *email: irinapravdziva@gmail.com
Purpose. To determine the correlations between yield and grain quality indicators of varieties and breeding lines of winter bread wheat. Methods. The study was conducted under the conditions of the V. M. Remeslo Myronivka Institute of Wheat NAAS of Ukraine (MIW) during 2019/20–2021/22. Ten new varieties and four breeding lines of winter bread wheat of Myronivka breeding were evaluated. Grain quality indicators were determined in the grain quality laboratory of MIW according to conventional techniques. Pearson’s correlation coefficients (r) were calculated to establish correlations. Results. Correlations with different direction and strength were found between yield and quality indicators of winter bread wheat grain (–0.32 < r < 0.61). During the research years, reliable direct correlation coefficients were obtained between yield and the 1000 kernel weight indicator (r = 0.17–0.46). Also, a reliable linear dependence (r = 0.13–0.61) of yield with water absorption capacity of flour, test weight, grain vitreous, with protein and wet gluten content, but only under certain hydrothermal growing conditions. The varieties and breeding lines of winter bread wheat were identified which, during the years of research, showed stable direct correlations between yield and the indicators of 1000 kernel weight, grain vitreous, protein content, wet gluten content, sedimentation value, dough elasticity index, deformation energy, dough tenacity, water absorption capacity of flour. Conclusion. The selected varieties and breeding lines of winter bread wheat can be used in the breeding process as sources for combining high yield with certain improved quality indicators in one genotype to create competitive varieties.
Keywords: winter bread wheat; yield; grain quality indicators; flour quality indicators; rheological properties of dough; correlation coefficient; coefficient of variation.
Iryna Pravdziva
https://orcid.org/0000000208081584
Nadiia Vasylenko
https://orcid.org/0000000243266613
Nelia Khoroshko
https://orcid.org/0000000206631968
Introduction
Wheat (Triticum aestivum L.) is one of the most widely grown and valuable food crops in the world. It is grown on 220 million hectares, representing 15% of the world’s arable land [1]. The annual growth of the world’s population requires an increase in the production of agricultural products, especially wheat [2, 3]. Increasing the gross yield of high quality cereals is therefore of paramount importance [4, 5]. Soil and climatic growing conditions, biological characteristics of the variety, agrotechnical and other factors have a significant influence on the level of yield and quality of wheat grain [6, 7]. The maximum yield of wheat is formed under the optimal ratio of influence of all factors [8].
The most effective factor determining the yield level of agricultural crops is the variety [9]. Timely variety replacement can increase wheat grain yield by 40–60% [10]. When breeding new wheat varieties, breeders need to combine their high yield with a complex of valuable characteristics, in particular with parameters of grain quality [11]. The method of correlation analysis [12] is used to distinguish valuable varieties and breeding lines, since the identification of traits correlated with yield will contribute to increasing the competitiveness of plant varieties [6, 13]. The determination of correlations makes it possible to identify traits that are factorial and can be used as criteria (markers) for selection to increase productivity and at the same time genetic improvement of other indicators [14, 15].
The majority of scientific publications are devoted to determining the relationship between yield and productivity elements [10, 13, 16]. The dependence of yield on some indicators of grain quality is also highlighted in the literature. In fact, direct relationships of yield with 1000 kernel weight have been established [17, 18]. A significant number of works point to the inverse relationship between yield and grain protein content [3, 19, 20]. However, some research has shown direct correlations between yield and protein and gluten content in wheat grain [21, 22]. And only a small number of publications detail the relationships between yielding capacity and a wide range of quality indicators [23, 24].
The aim of the research is to determine correlations between yield and grain quality indicators of varieties and breeding lines of Triticum aestivum L.
Materials and methods
Ten varieties and four breeding lines of winter bread wheat were used as research material: ‘Podolianka’, ‘MIP Fortuna’, ‘MIP Yuvileina’, ‘MIP Nika’, ‘MIP Roksolana’, ‘MIP Feieriia’, ‘MIP Aelita’, ‘MIP Vidznaka’, ‘MIP Darunok’, ‘MIP Dovira’, ‘Lutescens 37548’, ‘Lutescens 60049’, ‘Lutescens 60302’, ‘Lutescens 60400’, which were sown in three sowing dates (25 September, 5 October, 15 October) after five precrops (green manure, mustard, sunflower, maize, soybean) during 2019/20–2021/22 on the basis of the V. M. Remeslo Myronivka Institute of Wheat of the National Academy of Agrarian Sciences of Ukraine (MIW).
The soil at the trial site is a deep, low humus, slightly leached, medium loamy chernozem. The granulometric composition of the soil is suitable for wheat cultivation and the level of fertility contributes to the overall evaluation of varieties and breeding lines of winter wheat.
The generally accepted technology of winter wheat cultivation for the Forest-Steppe zone was used [25]. The registered area of the experimental plots is 10 m2. There were four replications. Harvesting and recording of the harvest was carried out according to the methodology of the qualification examination of plant varieties for suitability for distribution in Ukraine [26]. Determination of grain quality indicators of winter bread wheat was carried out in the Grain Quality Laboratory of the MIW from each replicate according to generally accepted methods [27, 28].
Statistical processing of experimental data was carried out using correlation and variation analysis methods. Correlation analysis was used to identify potential genetic relationships between yield and grain quality indicators [29]. The Pearson’s correlation coefficient (r) was interpreted according to the Chaddock scale [30]. Coefficient of variation (Cv) was interpreted according to the scale [30]: Cv ≤ 5% – low variation, 6 ≤ Cv ≤ 10% – moderate, 11 ≤ Cv ≤ 20% – significant, 21 ≤ Cv ≤ 50% – high, Cv ≥ 51% is very high.

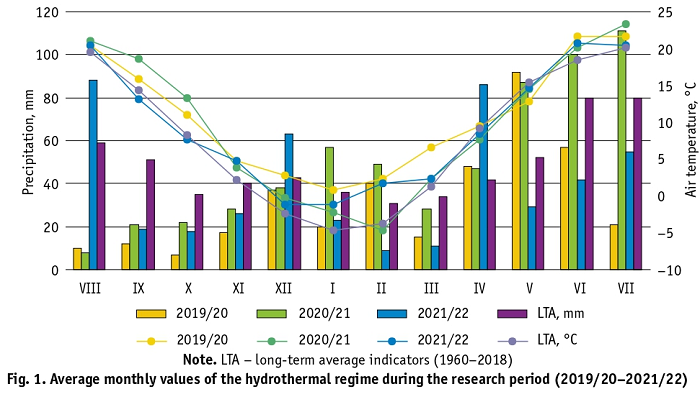
Research conditions. The study years were contrasting in the hydrothermal regime, with an uneven distribution of precipitation by month (Fig. 1). In general, the 2019/20 and 2021/22 growing years were characterised by an insufficient amount of precipitation (64.5 and 80.5% of the long-term average (LTA), respectively), with air temperature exceeding the LTA by 2.7 and 1.2 °C, respectively. Conditions in 2020/21 were close to the long-term average in terms of precipitation (102.2% of the LTA), but the air temperature was 9.8 °С compared to the long-term average of 8.2 °С. December, January, February and March 2019/20, September and October 2020/21, February 2021/22 turned out to be unusually warm, with an excess of 4.2–6.2 °C over the average daily air temperature. It should be noted that there was a significant lack of precipitation in August 2019/20 and 2020/21 (16.9 and 13.6% of LTA, respectively), in January, June and July 2019/20 and 2021/22 (26.3–71.3% of LTA), February and May 2021/22 (29.0 and 55.8% of LTA, respectively). The pre-sowing and sowing periods of the three study years were characterised by insufficient rainfall (23.5–62.9% of LTA). Critically low moisture availability during most months in 2019/20, accompanied by high air temperatures, negatively affected the growth and development of winter wheat.
Results and discussion
The obtained experimental results show the variability of yield and grain quality indicators of winter bread wheat depending on the hydrothermal conditions of the study years (Table 1). Under the dry growing conditions of 2019/20, higher flour, dough and bread quality indicators were obtained, but the lowest values of yield (3.33 t/ha) and 1000 kernel weight (36.4 g) were obtained. The wettest growing season 2020/21 contributed to the formation of the highest level of yield (6.46 t/ha) and 1000 kernel weight (41.5 g), but at the same time a decrease in the quality indicators of flour and dough was observed. A low variation (Cv ≤ 5%) between years was observed for the following indicators: test weight, gluten deformation index, water absorption capacity of flour, porosity of bread crumb, bread evaluation score. A moderate variation (6 ≤ Cv ≤ 10%) between years was observed for 1000 kernel weight, grain vitreous, sedimentation value, dough elasticity index and volume of bread. Yield (Cv = 31.7%) and flour strength (Cv = 27.9%) were more dependent on hydrothermal conditions.
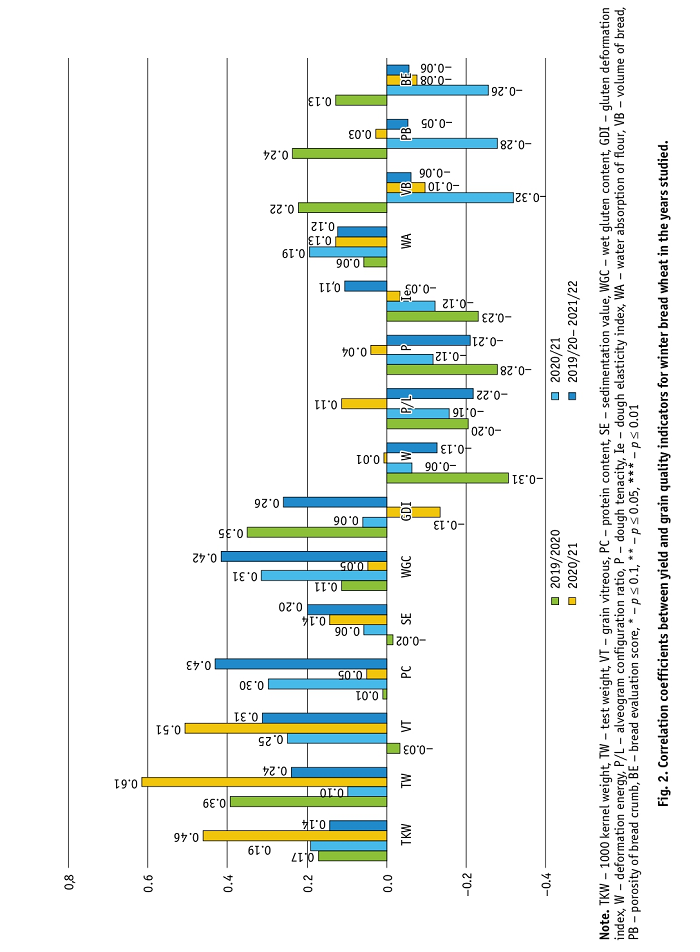
To determine the direction and strength of the relationship between yield and grain quality indicators, Pearson’s correlation coefficients (r) were calculated (Fig. 2). In 2019/2020–2021/22, a reliable direct correlation of yield was found only with 1000 kernel weight (r = 0.17–0.46). Direct reliable correlations of yield with water absorption of flour, test weight and grain vitreous were observed in two of the study years. Direct reliable correlations of yield with protein (r = 0.30) and gluten (r = 0.31) content were found in one of the years, namely 2020/21. It should be noted that in other years the correlation coefficients between yield and these characteristics were positive but unreliable. No stable relationships were found between yield and other grain quality indicators. Significant variability of the correlation coefficients, both in strength and direction, depending on the hydrothermal conditions of the year, was also observed in the studies of O. Yu. Leonov et al. [31]. In the conditions of Central Asia it was also found that the correlation coefficients between yield and quality indicators of grain and flour depended on the characteristics of the soil and climatic zone of cultivation [32].
According to the research of V. V. Liubych et al. [33], correlation coefficients depend on both growing conditions and genotype. Therefore, we calculated correlation coefficients between yield and grain quality indicators for individual varieties and breeding lines of winter wheat.

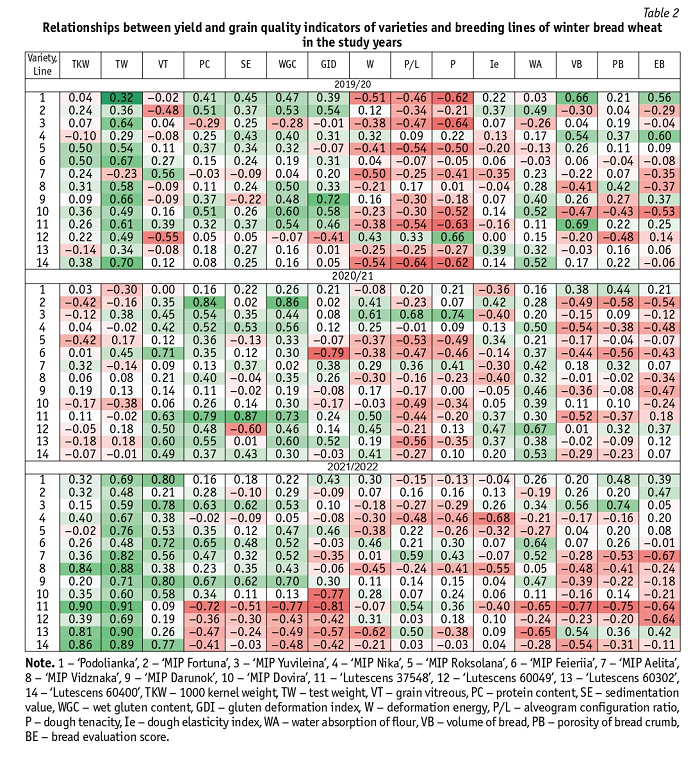
As a result of the research conducted for varieties and breeding lines of winter wheat, significant variability of the correlation coefficients between yield and grain quality indicators was revealed in the test years, both in terms of the strength and direction of the relationships (Table 2). This indicates a significant influence of the weather conditions of the year on the formation of yield and grain quality indicators, as well as the unequal response of genotypes to growing conditions.
We have selected varieties and breeding lines of winter wheat with stable direct correlations of yield over the years with some indicators of grain quality, namely: by 1000 kernel weight – ‘MIP Aelita’ (r = 0.24–0.36), ‘Lutescens 37548’ (r = 0.11–0.90); test weight – ‘MIP Yuvileina’ (r = 0.38–0.64), ‘MIP Feieriia’ (r = 0.45–0.67), ‘MIP Darunok’ (r = 0.13–0.71), ‘Lutescens 60049’ (r = 0.18–0.69); grain vitreous – ‘MIP Roksolana’ (r = 0.11–0.53), ‘MIP Feieriia’ (r = 0.27–0.72), ‘Lutescens 60400’ (r = 0.12–0.77); protein and wet gluten content – ‘Podolianka’ (respectively r = 0.16–0.41 and r = 0.22–0.47), ‘MIP Fortuna’ (respectively r = 0.28–0.84 and r = 0.29–0.86), ‘MIP Roksolana’ (respectively r = 0.35–0.37 and r = 0.32–0.47), ‘MIP Feieriia’ (respectively r = 0.15–0.65 and r = 0.19–0.52), ‘MIP Vidznaka’ (respectively r = 0.11–0.40 and r = 0.35–0.50), ‘MIP Darunok’ (respectively r = 0.11–0.67 and r = 0.19–0.70), ‘MIP Dovira’ (respectively r = 0.26–0.51 and r = 0.13–0.60); sedimentation value – ‘Podolianka’ (r = 0.18–0.45), ‘MIP Yuvileina’ (r = 0.25–0.65), ‘MIP Feieriia’ (r = 0.12–0.48), ‘MIP Dovira’ (r = 0.11–0.26); dough elasticity index – ‘MIP Fortuna’ (r = 0.13–0.42); deformation energy – ‘MIP Darunok’ (r = 0.11–0.17), ‘Lutescens 60049’ (r = 0.31–0.45); dough tenacity – ‘Lutescens 60049’ (r = 0.13–0.66); water absorption of flour – ‘MIP Aelita’ (r = 0.23–0.52), ‘MIP Darunok’ (r = 0.40–0.46), ‘MIP Dovira’ (r = 0.11–0.52). The obtained results indicate that already today varieties and promising breeding lines have been created, which form a higher level of yield with simultaneously increased grain quality indicators. The selected varieties and breeding lines can be used in the breeding process as sources of combination in one genotype of high yield with corresponding high grain quality indicators.
Conclusions
Direct and inverse correlations of varying strength (–0.32 < r < 0.61) were found between yield and grain quality indicators of winter bread wheat. There was a linear dependence (r = 0.13–0.61) of yield on 1000 kernel weight in all years of the study, on water absorption capacity of flour, test weight and grain vitreous in two years, and on protein and gluten content in one year.
We have selected varieties and breeding lines of winter bread wheat with stable direct relationships between yielding capacity and quality indicators: 1000 kernel weight – ‘MIP Aelita’, ‘Lutescens 37548’; test weight – ‘MIP Yuvileina’, ‘MIP Feieriia’, ‘MIP Darunok’, ‘Lutescens 60049’; grain vitreous – ‘MIP Roksolana’, ‘MIP Feieriia’, ‘Lutescens 60400’; protein and gluten content – ‘Podolianka’, ‘MIP Fortuna’, ‘MIP Roksolana’, ‘MIP Feieriia’, ‘MIP Vidznaka’, ‘MIP Darunok’, ‘MIP Dovira’; sedimentation value – Podolianka’, ‘MIP Yuvileina’, ‘MIP Feieriia’, ‘MIP Dovira’; dough elasticity index – ‘MIP Fortuna’; deformation energy – ‘MIP Darunok’, ‘Lutescens 60049’; dough tenacity – ‘Lutescens 60049’; water absorption of flour – ‘MIP Aelita’, ‘MIP Darunok’, ‘MIP Dovira’. It is recommended to use the selected varieties and lines in the breeding process to create competitive high–yielding varieties with increased quality indicators of winter bread wheat.
Table 1
Yield and grain quality indicators of winter bread wheat (average by sowing dates, preceding crops, varieties and breeding lines)
|
Yield and quality indicators |
2019/20 |
2020/21 |
2021/22 |
Cv, % |
|
Yield, t/ha |
3.33 |
6.46 |
5.80 |
31.7 |
|
1000 kernel weight, g |
36.4 |
41.5 |
37.6 |
6.9 |
|
Test weight, g/l |
764 |
764 |
758 |
0.4 |
|
Vitreous grain, % |
68 |
67 |
74 |
5.6 |
|
Protein content, % |
14.7 |
11.9 |
13.0 |
12.6 |
|
Sedimentation value, ml |
64 |
59 |
68 |
8.9 |
|
Wet gluten content, % |
31.9 |
27.4 |
29.4 |
10.5 |
|
Gluten deformation index, un. GDM |
74 |
74 |
76 |
1.8 |
|
Deformation energy, 10–4J |
190 |
236 |
328 |
27.9 |
|
Alveogram configuration ratio, un. |
1.0 |
1.2 |
1.4 |
18.2 |
|
Dough tenacity, mm |
78 |
81 |
107 |
18.2 |
|
Dough elasticity index, % |
64.3 |
68.0 |
76.5 |
9.0 |
|
Water absorption of flour, % |
57.8 |
57.7 |
60.9 |
3.1 |
|
Volume of bread, cm³ |
919 |
848 |
752 |
10.0 |
|
Porosity of bread crumb, % |
81 |
87 |
82 |
3.6 |
|
Bread evaluation score, grade points |
3.7 |
3.8 |
3.5 |
3.0 |
Note. Cv – Coefficient of variation; un. GDM – units of gluten deformation meter.

Note. 1 – ‘Podolianka’, 2 – ‘MIP Fortuna’, 3 – ‘MIP Yuvileina’, 4 – ‘MIP Nika’, 5 – ‘MIP Roksolana’, 6 – ‘MIP Feieriia’, 7 – ‘MIP Aelita’, 8 – ‘MIP Vidznaka’, 9 – ‘MIP Darunok’, 10 – ‘MIP Dovira’, 11 – ‘Lutescens 37548’, 12 – ‘Lutescens 60049’, 13 – ‘Lutescens 60302’, 14 – ‘Lutescens 60400’, TKW – 1000 kernel weight, TW – test weight, VT – grain vitreous, PC – protein content, SE – sedimentation value, WGC – wet gluten content, GDI – gluten deformation index, W – deformation energy, P/L – alveogram configuration ratio, P – dough tenacity, Ie – dough elasticity index, WA – water absorption of flour, VB – volume of bread, PB – porosity of bread crumb, BE – bread evaluation score.
References
УДК 633.111.1“324”:631.559
Правдзіва І. В.*, Василенко Н. В., Хорошко Н. М. Дослідження кореляційних зв’язків між урожайністю та показниками якості зерна сортів і селекційних ліній Triticum aestivum L. Plant Varieties Studying and Protection. 2023. Т. 19, № 4. С. --–--. https://doi.org/10.21498/2518-1017.19.4.2023.291222
Миронівський інститут пшениці імені В. М. Ремесла НААН, вул. Центральна, 68, с. Центральне, Обухівський р-н, Київська обл., 08853, Україна, *e-mail: irinapravdziva@gmail.com
Мета. Визначити кореляційні зв’язки між урожайністю та показниками якості зерна сортів і селекційних ліній пшениці м’якої озимої. Методи. Дослідження проводили в умовах Миронівського інституту пшениці імені В. М. Ремесла НААН України (МІП) впродовж 2019/20–2021/22 рр. Оцінювали десять нових сортів і чотири селекційні лінії пшениці м’якої озимої миронівської селекції. Показники якості зерна визначали згідно із загальноприйнятими методами в лабораторії якості зерна МІП. Для встановлення кореляційних зв’язків розраховували коефіцієнти кореляції (r) Пірсона. Результати. Між урожайністю та показниками якості зерна пшениці м’якої озимої встановлено різні за напрямом та силою кореляційні зв’язки ( 0,32 < r < 0,61). Зокрема, в роки досліджень одержано вірогідні прямі коефіцієнти кореляції між урожайністю та показником маси 1000 зерен (r = 0,17–0,46). Також за певних гідротермічних умов вирощування виявлено вірогідну прямолінійну залежність (r = 0,13–0,61) урожайності від водопоглинальної здатності борошна, натури, склоподібності зерна, вмісту білка та клейковини. Виділено сорти й селекційні лінії пшениці м’якої озимої, які під час досліджень мали стабільно прямі кореляційні зв’язки між врожайністю та масою 1000 зерен, склоподібністю зерна, вмістом білка, вмістом клейковини, індексом еластичності тіста, силою борошна, пружністю тіста, водопоглинальною здатністю борошна. Висновки. Виокремлені сорти й селекційні лінії пшениці м’якої озимої можуть бути використані в селекційному процесі як джерела поєднання в одному генотипі високої врожайності та певних підвищених показників якості для створення конкурентоспроможних сортів.
Ключові слова: пшениця м’яка озима; врожайність; показники якості зерна; показники якості борошна; реологічні властивості тіста; коефіцієнт кореляції; коефіцієнт варіації.
Надійшла / Received 22.09.2023
Погоджено до друку / Accepted 15.11.2023